Signal visualization
In ultrasonic defectoscopy it is very difficult to detect flaws in materials with coarse-grain structure. Measured ultrasonic signal contains echoes from flaw and echoes from grains included in material. These echoes characterized noise have to be cancelled. For this purpose we use signal processing method based on discrete wavelet transform. In this work method based on neural networks for flaw detection in B-scan is used. Proposed methods are efficient used for separation of flaw from undesirable echoes. For visualization of flaw volume construction was created. The 3D volume visualization characterizes volumetric depiction of measured material. By using 3D volume visualization of ultrasonic signal it is possible to determine character and place of flaws in ultrasonic defectoscopy.
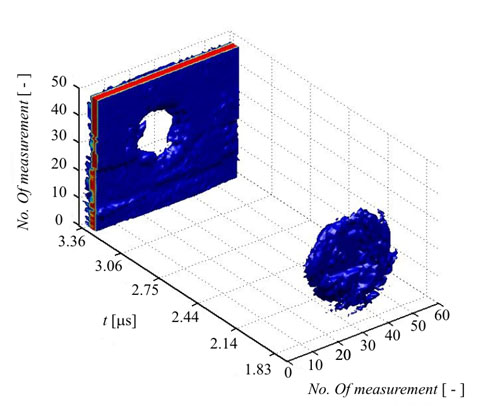
An ultrasonic system was created for measuring of ultrasonic signals using the ultrasonic transducer with frequency of 20 MHz. The system consists of units for measurement of ultrasonic signals and device for precise positioning of ultrasonic transducer. The transducer was moved by steps 250 mm. along the material and signals in time domain (A-scan) were measured and recorded. With the recorded A-scans a C-scan was created. By means of the C-scan a 3D volume visualization of the measured material was created. For measurement of ultrasonic signals materials with artificial flaw were used. In the first material a circle-shaped flaw was created. In the another material (which is used for construction of airplane engines) artificial flaws were created. 3D volume visualization of the material with the circle-shaped flaw is in the following figure:

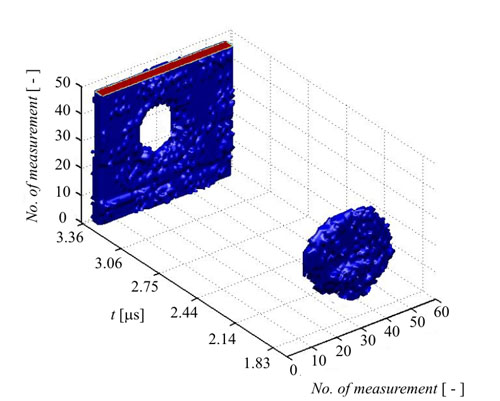
Using advanced methods (discrete wavelet transform, neural networks and expert systems) signal processing is accurate to visualize defects in the tested material. The result after applying the proposed methods is shown in the following figure:

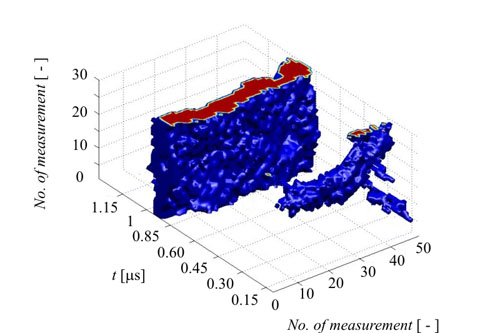
Our proposed method I put on real recorded signals and the application of the above methods, we obtain visualization of detected faults:

The system for detection of flaw consists of data acquisition, filtering, morphologic processing and the neural network. For detection of flaw a material with artificial circle shaped flaw was used. By mathematical morphology the C-scan sketches the shape of flaw. With application of neural network it is possible to characterize the shape of the flaw exactly. For the comparison a material with coarse grained structure where detection of flaw is difficult was used. Filtering of ultrasonic signal is useful for suppressing echoes from grains. In the future using the 3D volume visualization of ultrasonic signal it will be possible to determine the character and place of a generation of flaws in ultrasonic defectoscopy.
Applications
V Zahradách 24, 180 00 Prague 8, Czech Republic EU
Phone: +420 283 842 063, Fax: +420 283 841 067
www.starmans.cz, E-mail: ndt.starmans@gmail.com